Interactive data dashboard
Grazioso Salvare Rescue Animal Analytics Dashboard
A web-based analytics application that helps Grazioso Salvare identify shelter dogs suited to life-saving rescue training. The dashboard turns Austin Animal Center records into searchable, filterable, and visual information without requiring users to know database queries.
- Python
- MongoDB
- JupyterDash
- Pandas
- Plotly
- Dash Leaflet
Overview
Making shelter data useful for rescue decisions
The dashboard gives nontechnical users an intuitive way to explore animal records. Selecting a rescue category updates the candidate table, breed distribution, and geolocation map together so suitable dogs can be identified quickly.
Rescue categories
Purpose-built filters
- Water Rescue
- Mountain or Wilderness Rescue
- Disaster or Individual Tracking
- Reset to view the complete dataset
Core functionality
From database records to actionable insights
Reusable data access
A custom Python CRUD module connects the application to MongoDB and supports create, read, update, and delete operations.
Dynamic filtering
Radio-button filters query candidates by breed, sex, and age criteria defined for each rescue-training category.
Searchable data table
The dashboard presents shelter records in an interactive table that updates whenever the selected rescue category changes.
Linked visual analysis
Dash callbacks synchronize the table, Plotly breed-distribution chart, and Dash Leaflet geolocation map.
Dashboard gallery
Filters, tables, charts, and maps working together
Each filter refreshes the full analysis experience, keeping the candidate records and visual summaries synchronized.
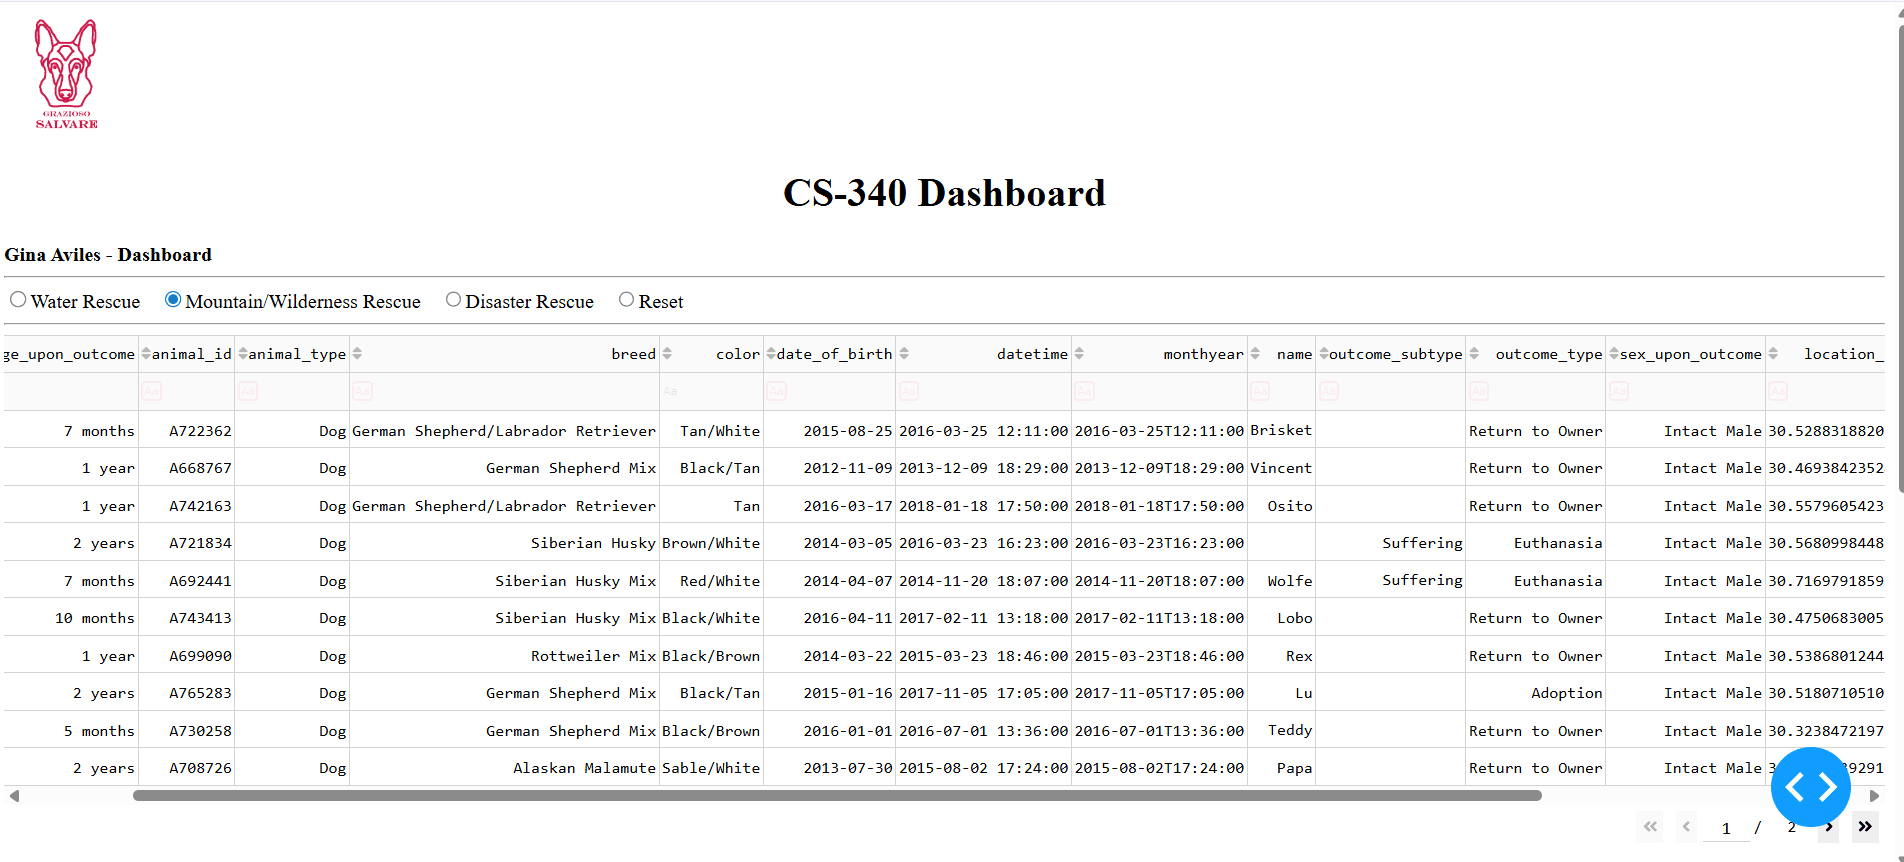
Mountain and wilderness candidates
The filtered table presents dogs that match mountain and wilderness rescue criteria.
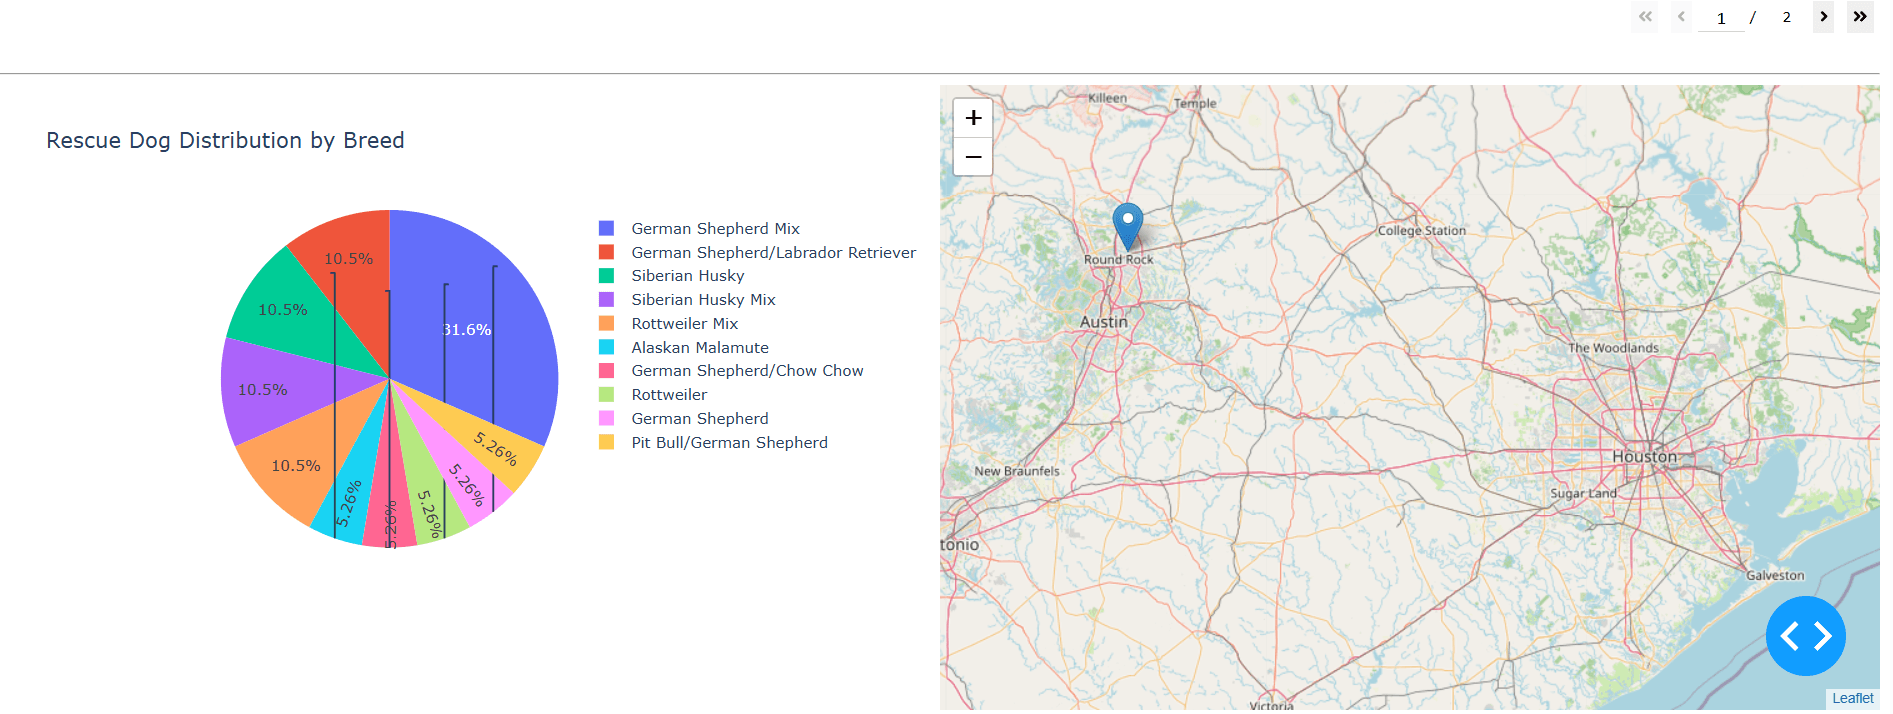
Mountain rescue analysis
The breed chart and map update to reflect the filtered candidate set.
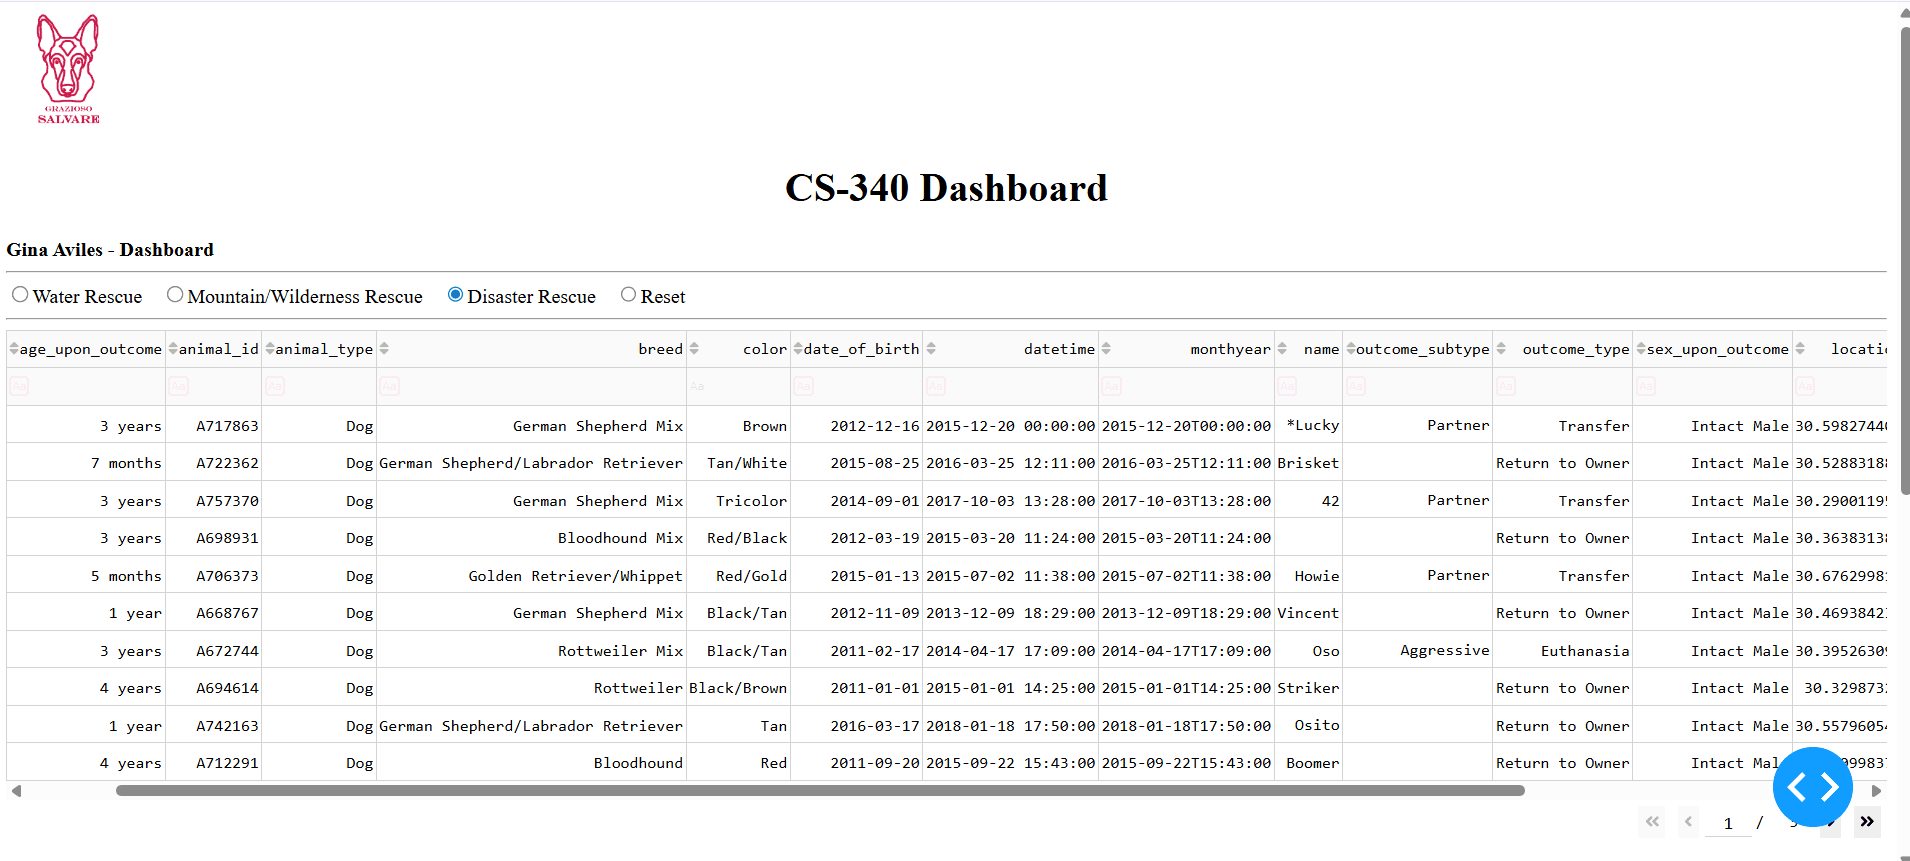
Disaster tracking candidates
The table updates when the disaster or individual tracking filter is selected.
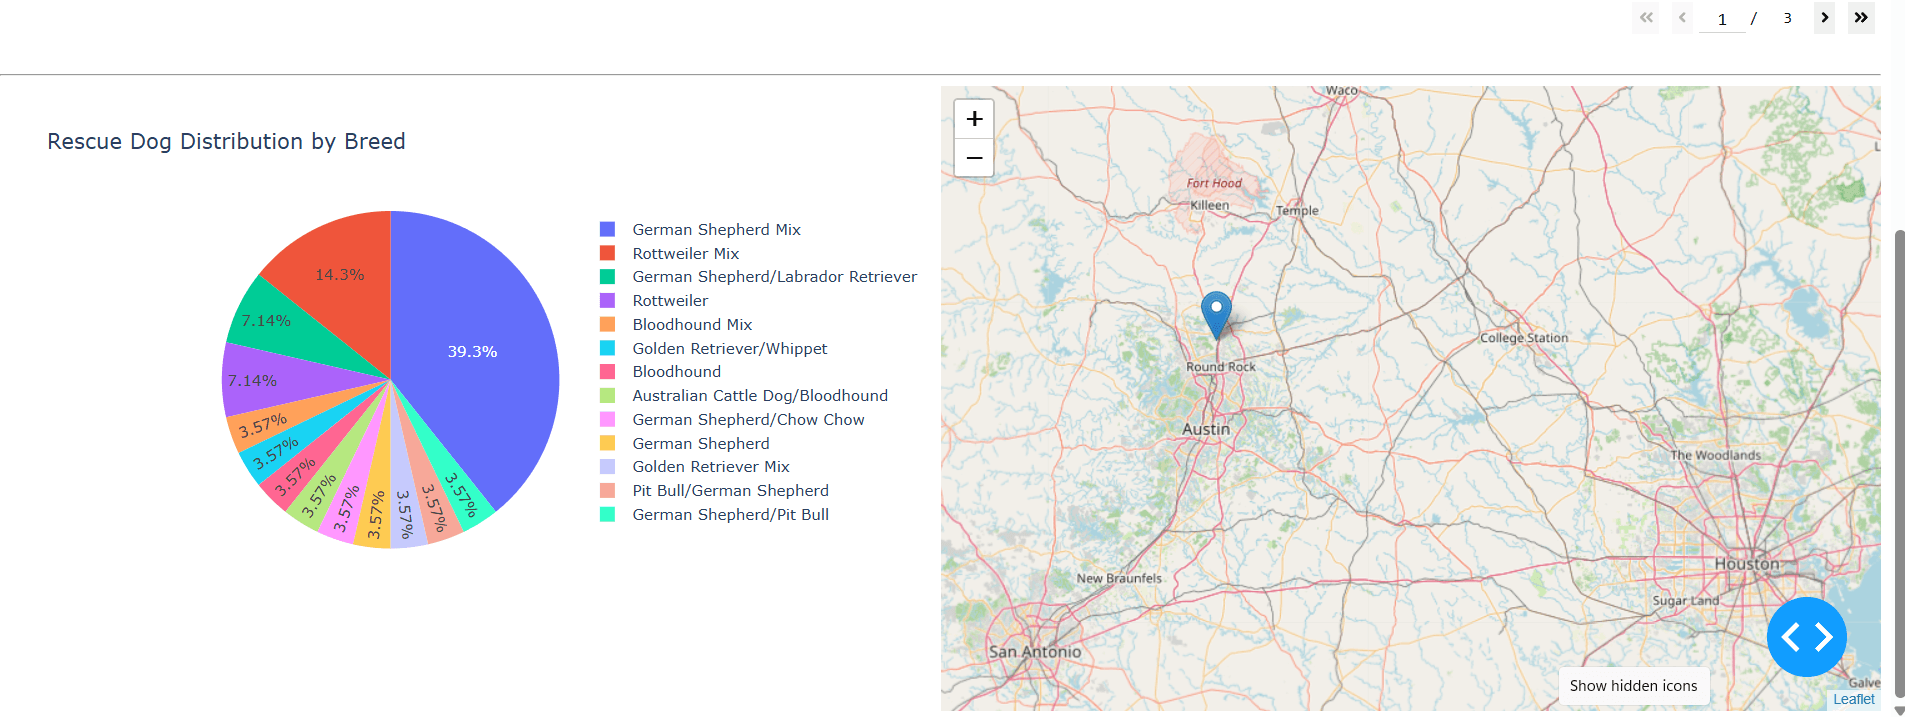
Disaster rescue analysis
Linked visualizations summarize breeds and show a selected animal’s location.
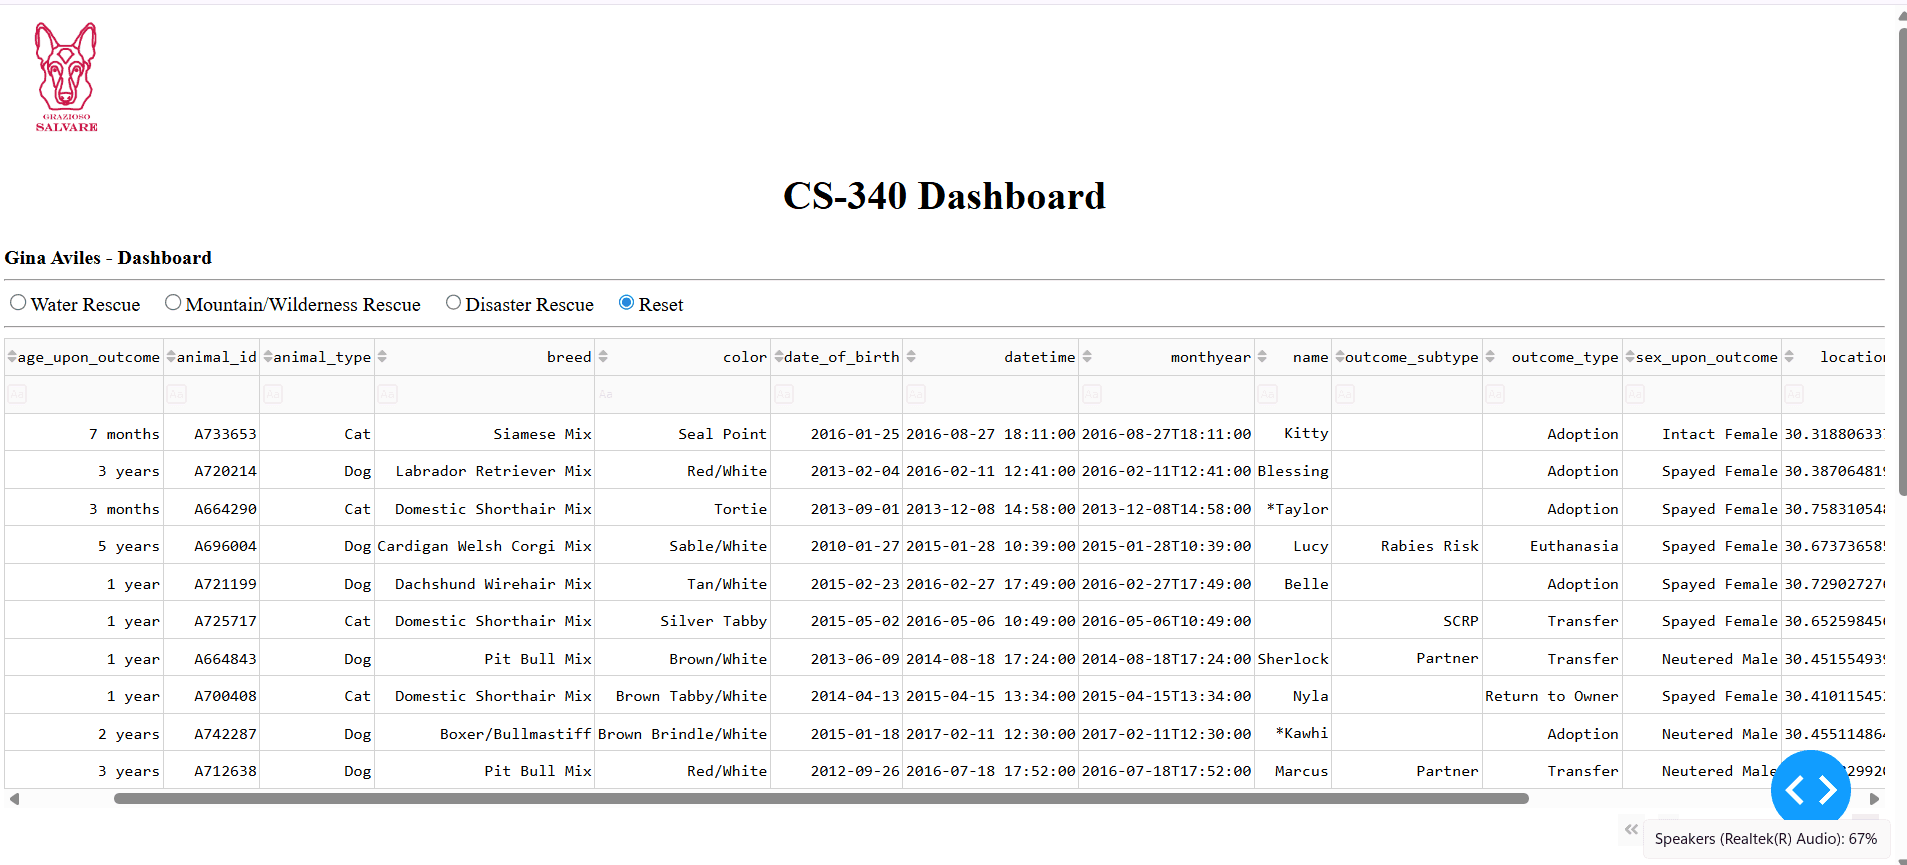
Complete shelter dataset
Reset returns the dashboard to the unfiltered Austin Animal Center data.
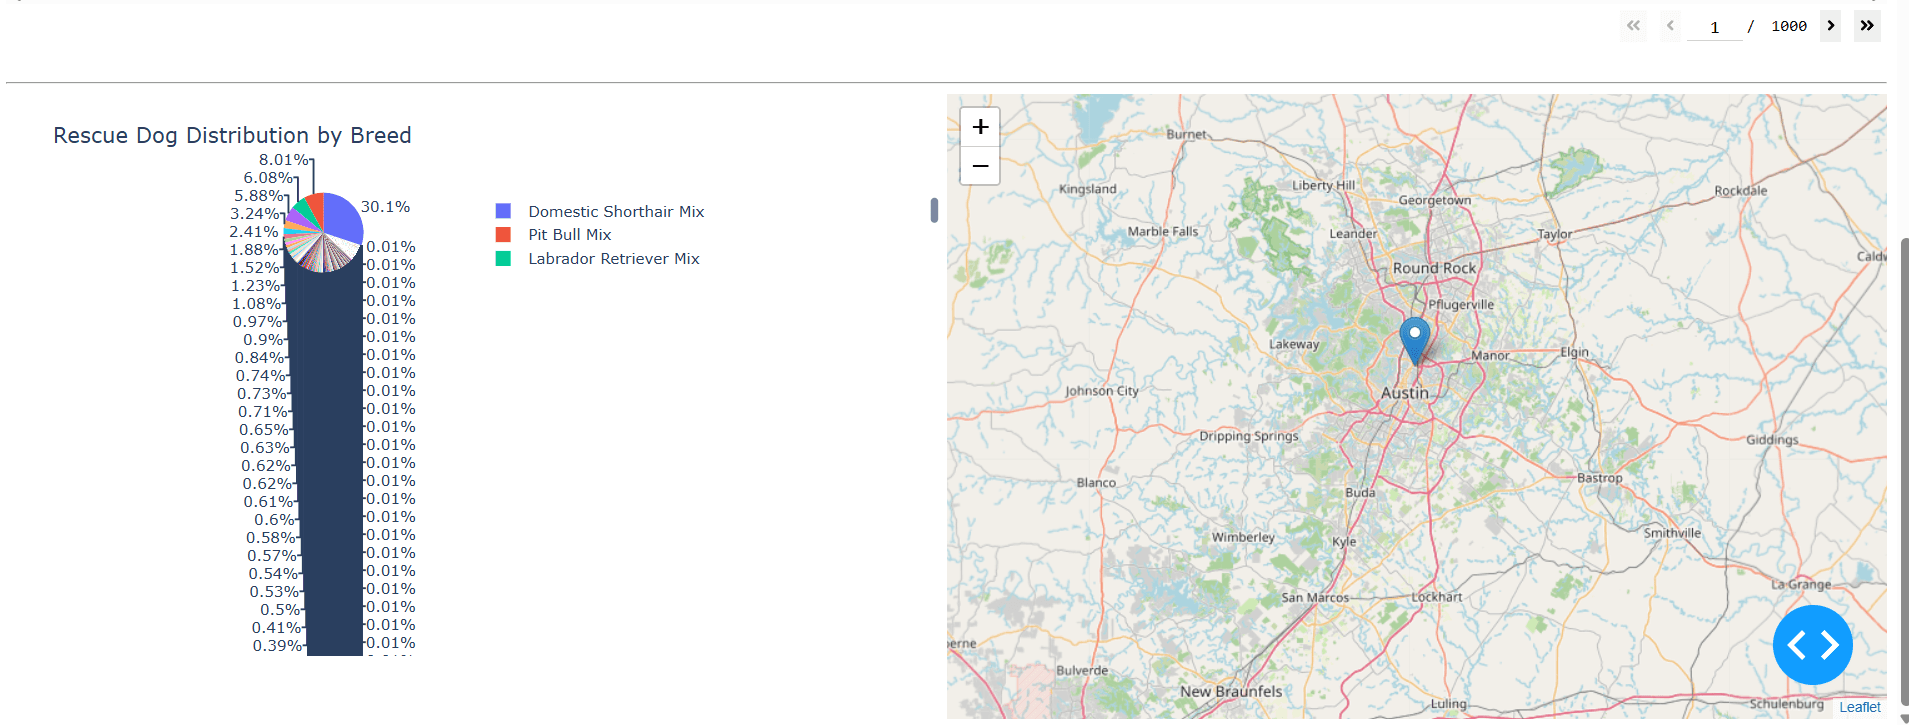
Complete dataset analysis
The chart and map return to the complete dataset when filters are cleared.
Development process
Building the data pipeline and interface
Imported and cleaned the Austin Animal Center dataset in MongoDB
Created a reusable Python CRUD module for database access
Built the Dash layout with filters, a data table, a chart, and a map
Developed MongoDB queries for breed, sex, and age requirements
Connected user input to dashboard components with Dash callbacks
Tested every rescue filter across all visual components
Challenges & solutions
Refining accuracy, reliability, and structure
Filtering logic accuracy
Challenge
The initial filters relied only on breed values and did not fully represent the rescue-training requirements.
Solution
Expanded the MongoDB queries to combine breed, sex, and age-range conditions from Grazioso Salvare’s specifications.
Dashboard callback errors
Challenge
Some callbacks failed when a selection produced missing, empty, or null values.
Solution
Added conditional checks before processing data so every component could handle empty states safely.
Layout structure
Challenge
Early dashboard versions contained syntax and component-nesting errors.
Solution
Corrected the Dash component hierarchy and verified that every layout container was structured properly.
Project outcome
An integrated decision-support tool for rescue training
The finished dashboard combines MongoDB, Python, and Dash into an interactive analysis tool. Grazioso Salvare can filter shelter records using meaningful rescue criteria and review matching candidates through coordinated tables, charts, and maps.